Link copied to clipboard.

More views. More enquiries. Better leads.

Data from AD Group's FY26 Q3 Market Insights Report saw activity on a-d.com.au climb - and the quality of that activity climbed with it.
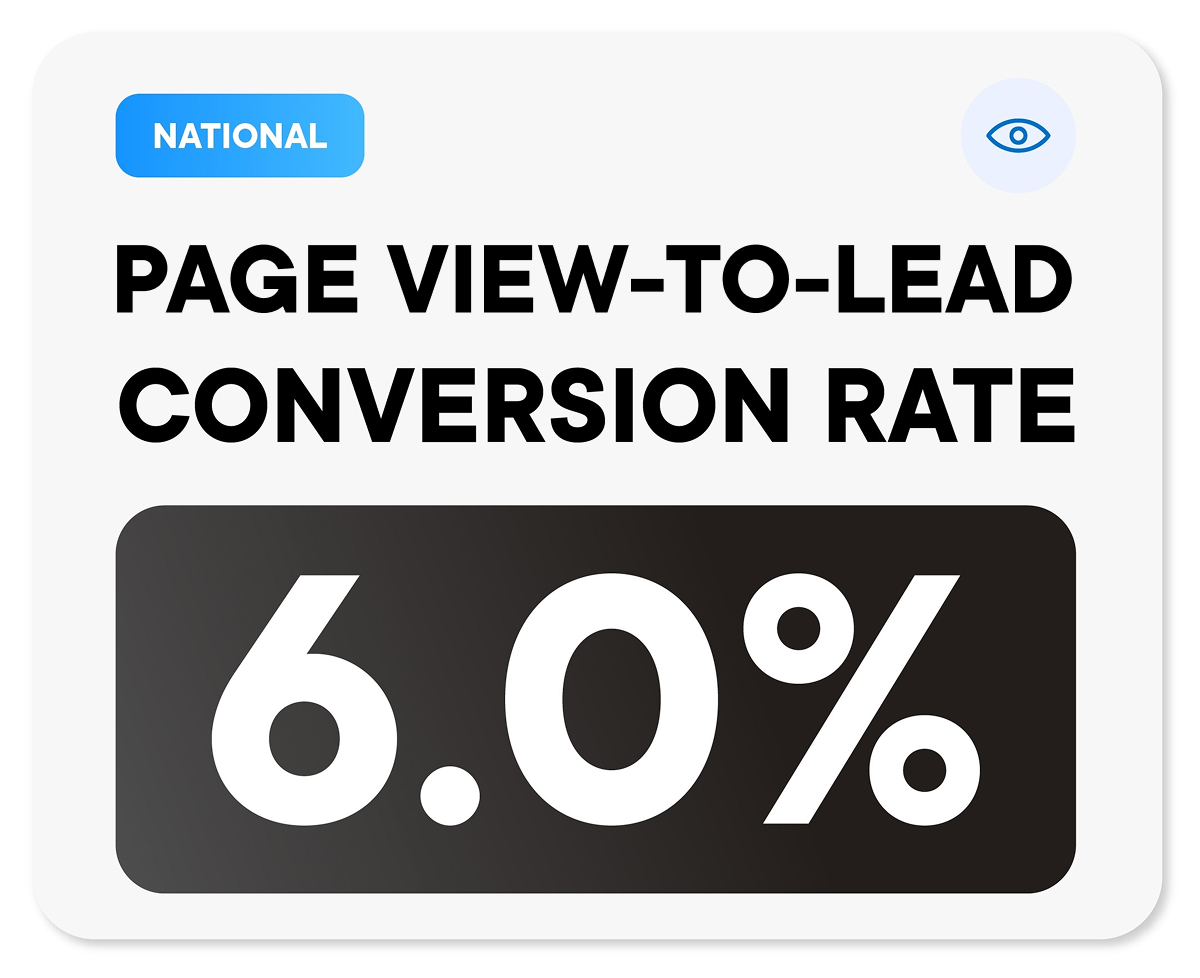
The national view-to-enquiry conversion rate hit 6.0% in FY26 Q3, up 0.33% on the previous quarter. Put simply: roughly 1 in 17 people who viewed a development on a-d.com.au went on to make an enquiry. In a digital environment where attention is cheap and intent is everything, that's a meaningful number.

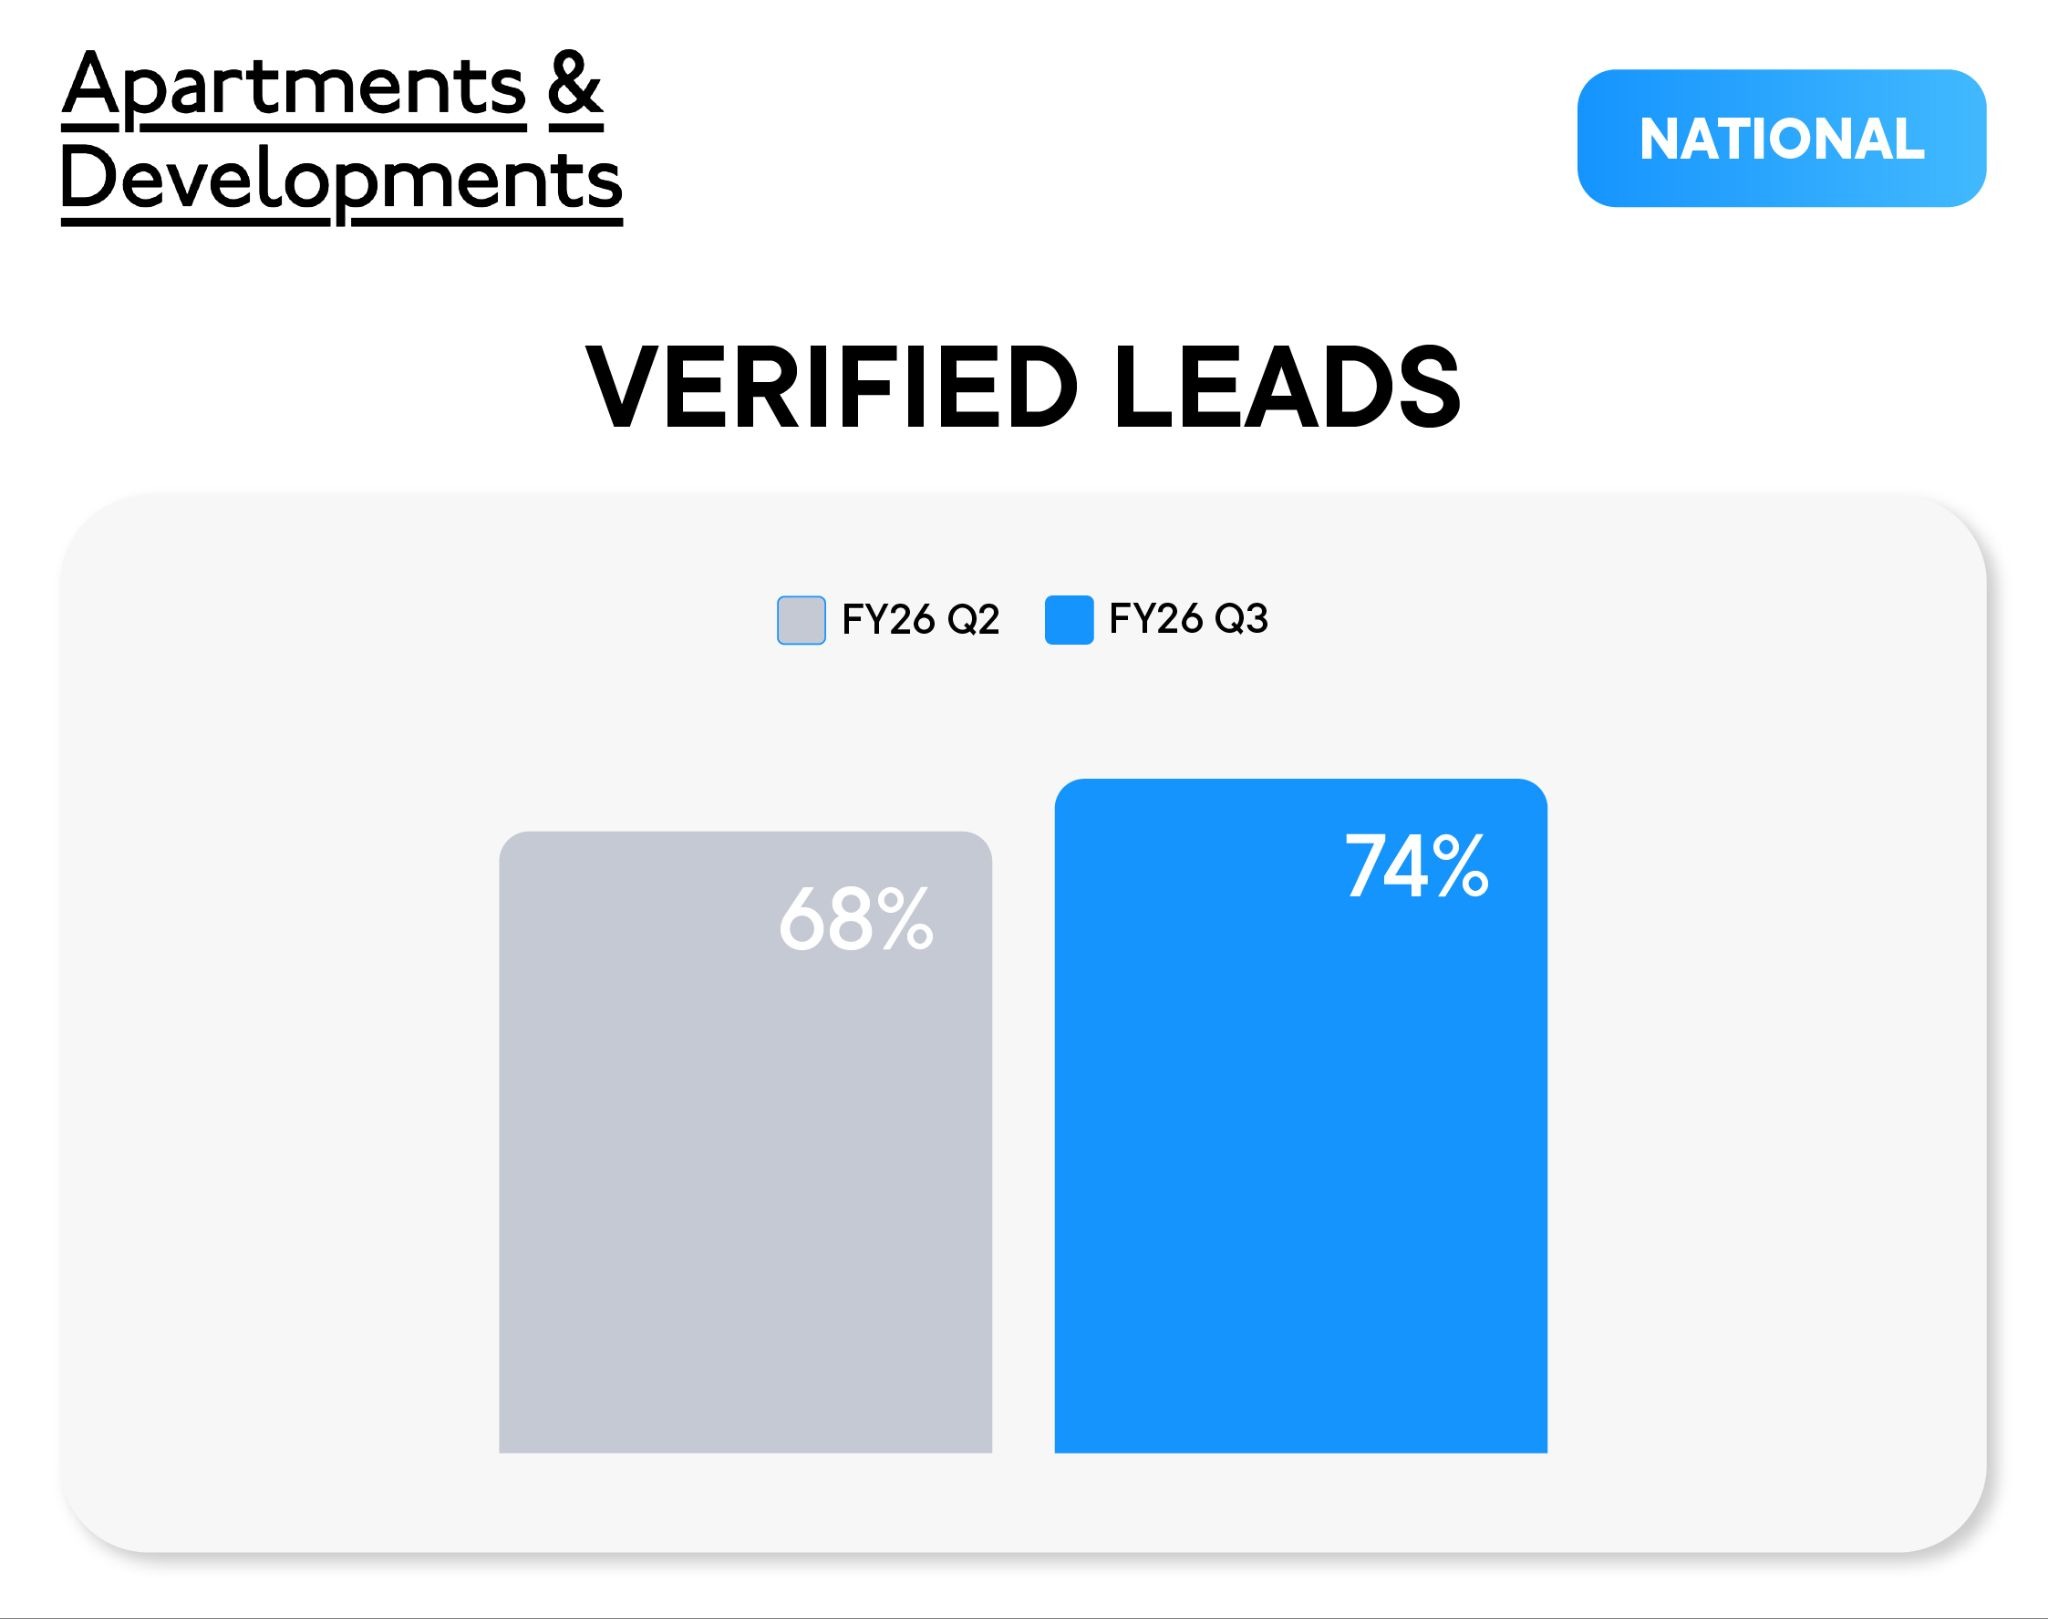
But it's the national verified leads data that tells perhaps a more compelling story. 74% of all leads generated on a-d.com.au in FY26 Q3 were verified, up from 68% in FY26 Q2. 

More views converting to enquiries. More of those enquiries confirmed as genuine. That's a cleaner, more actionable pipeline landing in your CRM - and it keeps improving quarter on quarter.

What’s transacting on DevelopmentID.com.au

The stock transacted on developmentID.com.au in FY26 Q3 told a clear story: channel agent partners sold higher-valued homes with larger bedroom configurations than the previous quarter.

The $1M-$2M price range accounted for the largest share of transactions at 34%, up from 28% in Q2. The $2M-$5M range grew from 11% to 22%, and the $5M+ segment moved from 2% to 15%. At the other end, the $500K-$1M range dropped from 59% to 29%.

On bedroom configurations, two-bedroom homes were the most transacted at 42%, up from 32% in FY26 Q2. Three-bedders grew from 15% to 25%, and four and five-bedroom homes also grew, from 1% to 8% and 4% respectively. 

One-bedroom configurations dropped from 51% to 21%, consistent with the shift towards higher-priced stock.

Download the full FY26 Q3 Market Insights Report here.

Share this article
Get our weekly news delivered straight to your inbox.
Thank you! You’re on the list.
Oops! Something went wrong while submitting the form.